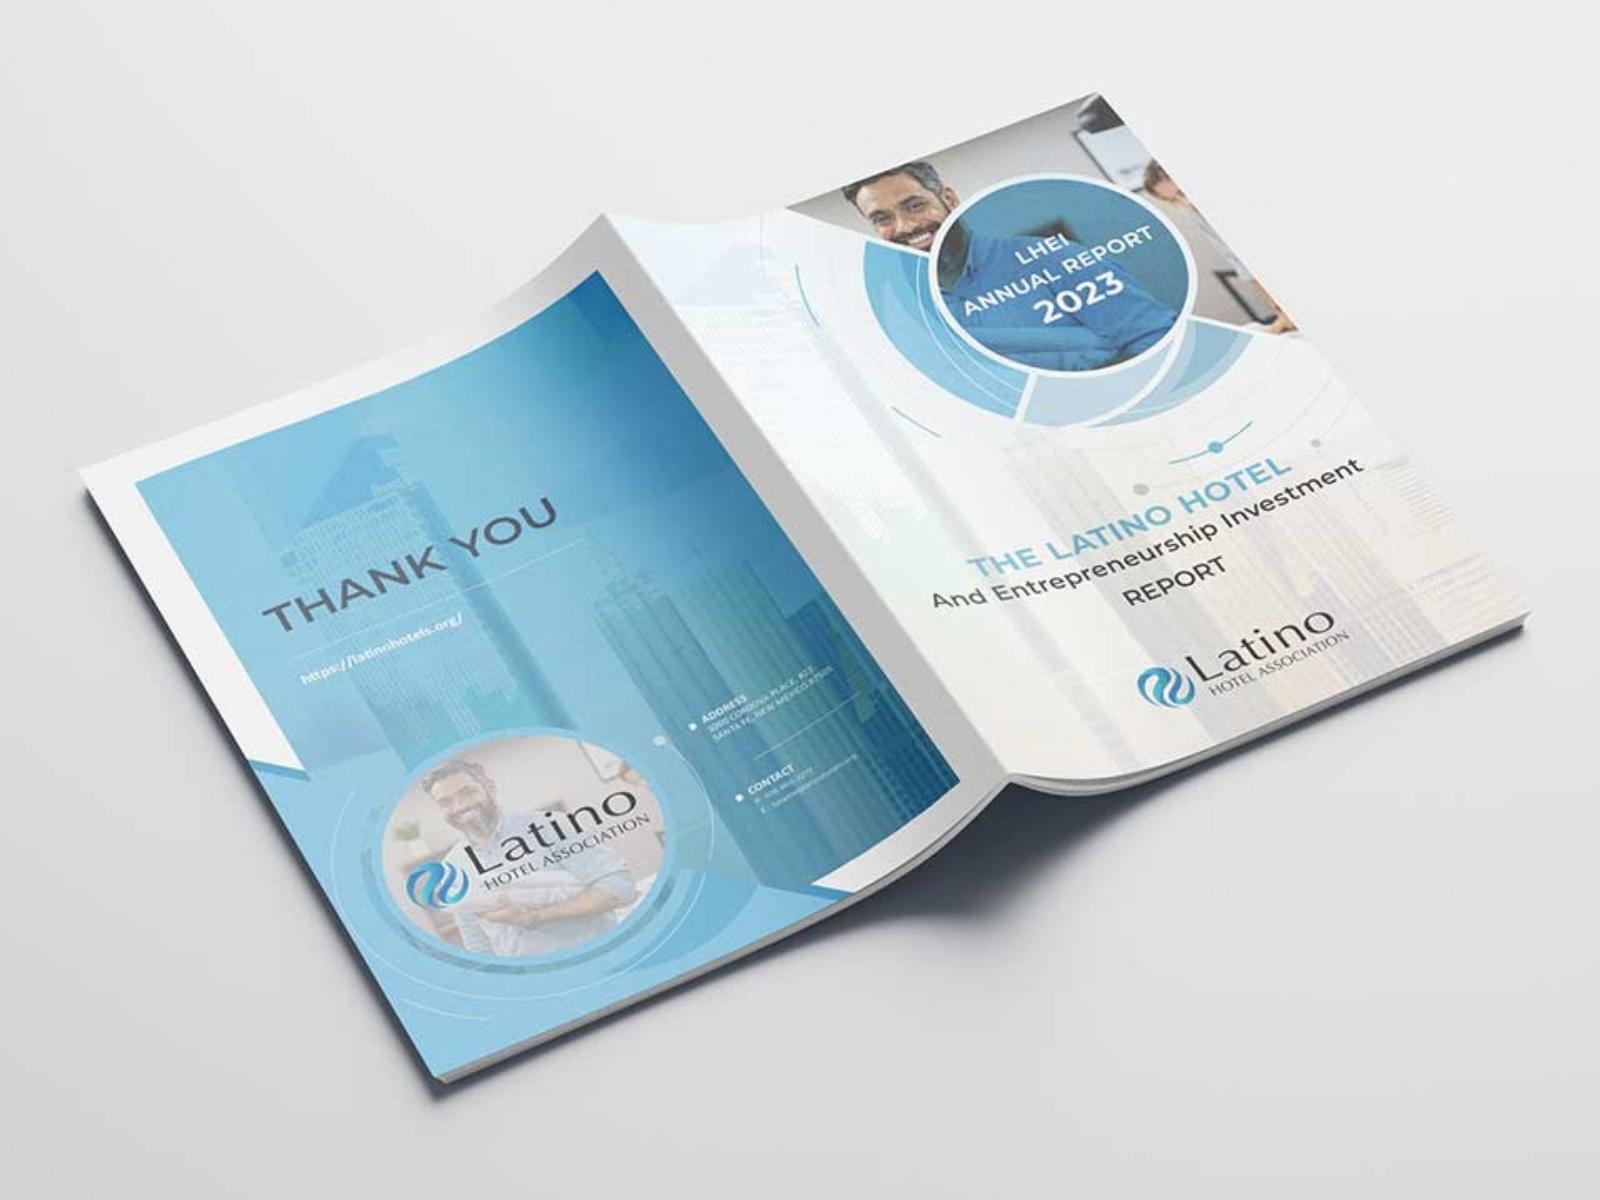
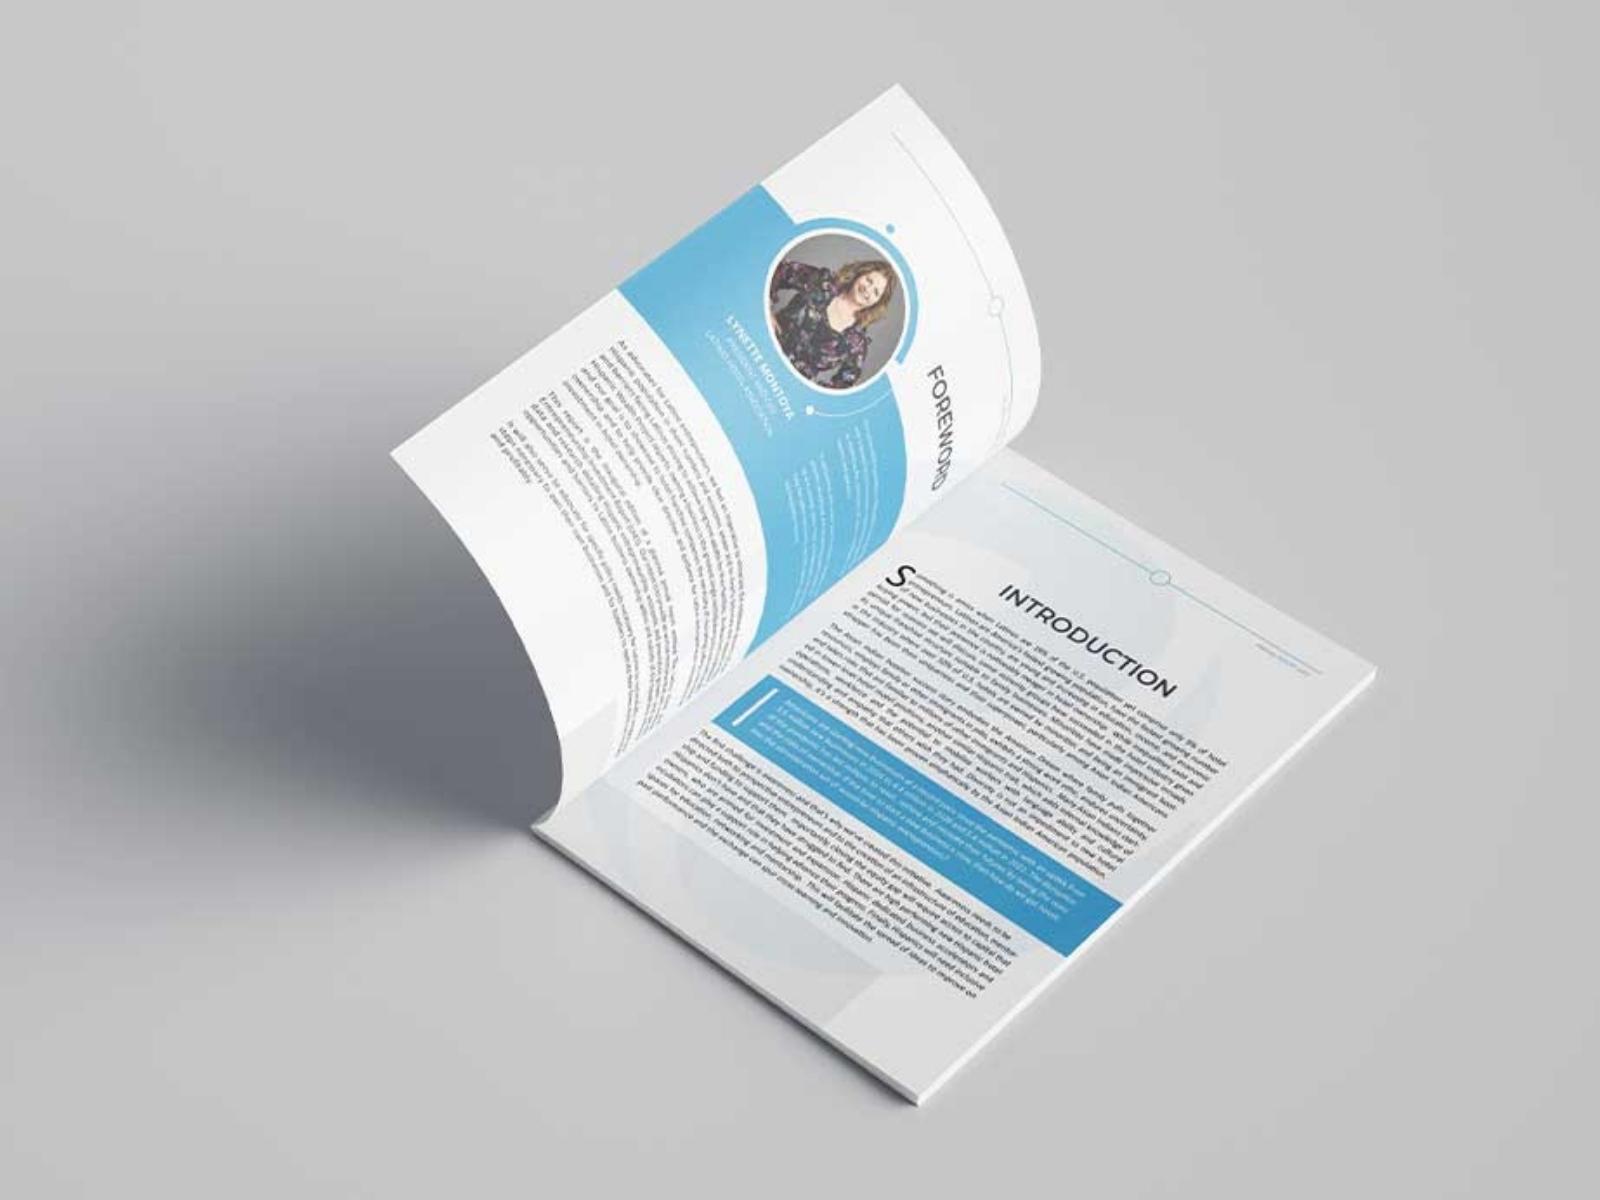
I designed a 40-page annual report for the Latino Hotel Association: financial tables, charts, member narrative, print-ready, plus a flipbook version for the site. It took 25 days from final content. That project is the benchmark behind the numbers below, and you can see the full case study rather than take my word for it.
The prices
| Pages | Price |
|---|---|
| 16 – 24 pages | $450 |
| 24 – 40 pages | $750 |
| 40 – 60 pages | $950 |
| 60 – 80 pages | $1,320 |
Flat prices, agreed before work starts. Annual reports arrive with content written and brand assets in hand — that is the nature of the document — so there is no writing add-on hiding in these figures. What you see is the design price.
- $450
- 16 – 24 pages
- $1,320
- 60 – 80 pages
- 25 days
- A real 40-page report
What actually drives the effort
| Factor | Effect |
|---|---|
| Page count | The base variable, and the one that sets the tier. |
| Charts and tables | Each custom chart is illustration work. Ten charts is a different project from two. |
| Photography | Supplied and edited is fast. Sourcing and retouching is not. |
| Print and digital | A flipbook or screen PDF alongside the press file is a small addition, not a second project. |
| Review committees | A board that reviews four times costs real calendar, whoever is designing. |
The clock, and when it starts
The Latino Hotel Association report ran 25 days from final content to delivered files. The words matter: from final content.
Most annual reports slip because design starts while the finance team is still closing numbers. A chart built on draft figures gets rebuilt. A page laid out around a 300-word section gets rebuilt when the section becomes 500 words. Two or three of those and a one-month project is two.
It is cheaper to wait two weeks for signed-off numbers than to start early and rebuild. Every time.
What you should have before design starts
- 01Final, proofread copy for every section, in one document.
- 02Signed-off financial data as a spreadsheet, not a PDF of a spreadsheet.
- 03Photography at full resolution, with any licensing already cleared.
- 04Your brand files: logo, typefaces, color values.
- 05A page count target, even a rough one. It sets the tier and the structure.
Nonprofit and impact reports
Impact reports follow the same economics with one difference: the story carries more weight than the audit. Donors read a narrative and check the financials; shareholders check the financials and skim the narrative. That changes where the design effort goes, not what it costs.
If you publish one every year, keep the InDesign file — it is included. The second year of a report is meaningfully faster than the first because the grid, the styles, and the chart treatments already exist. Quarterly publishers feel this even more: the Exness quarterly outlook, six pages, turned in three days on an established system.
What you get
- Press-ready PDF with bleed, crop marks, and CMYK conversion.
- Screen-optimized PDF, small enough to email, or a flipbook version for your site.
- The packaged InDesign file with fonts and links.
- Revisions until it is right — I do not cap rounds.
See the annual report service for the full scope, annual reports for professional and advisory firms for the industry page, or what a capability statement costs if you are comparing formats.